Final Project for THEAT 140 - Introduction to Perform: Desgin, incorporating design and R
Author
Ziling Zhen
Published
December 2, 2024
This project uses R to analyze package labels by creating visuals such as bar plots, wordclouds and tables, then using the results to design my own package label.
In today’s competitive marketplace, product labels play a critical role in capturing consumer attention and conveying brand identity. GraphicRiver is a part of the Envato Market, marketplace for digital assets that offers a diverse array of label designs that serve as valuable resources for businesses and creators. By examining the design trends and characteristics of these labels, we can uncover key insights into what makes a label visually appealing and effective in a commercial context. Using data collected from GraphicRiver and published on Kaggle, this dataset includes 622 rows and 9 columns, with each row representing a package label. Key columns include price, number of sales, rating, number of reviews, and the release date.
This project will integrate the design principles learned in the course Theater 140 - Introduction to Design for Performance with statistical programming techniques to analyze label design trends on Graphic River. The analysis will identify common features, text elements, and other covariates that contribute to a label’s popularity. I will then apply these findings to design my own product label. To deepen the exploration, I plan to compare my design to an AI-generated label based on the same analytical insights, offering a perspective on human versus machine creativity in design.
Code
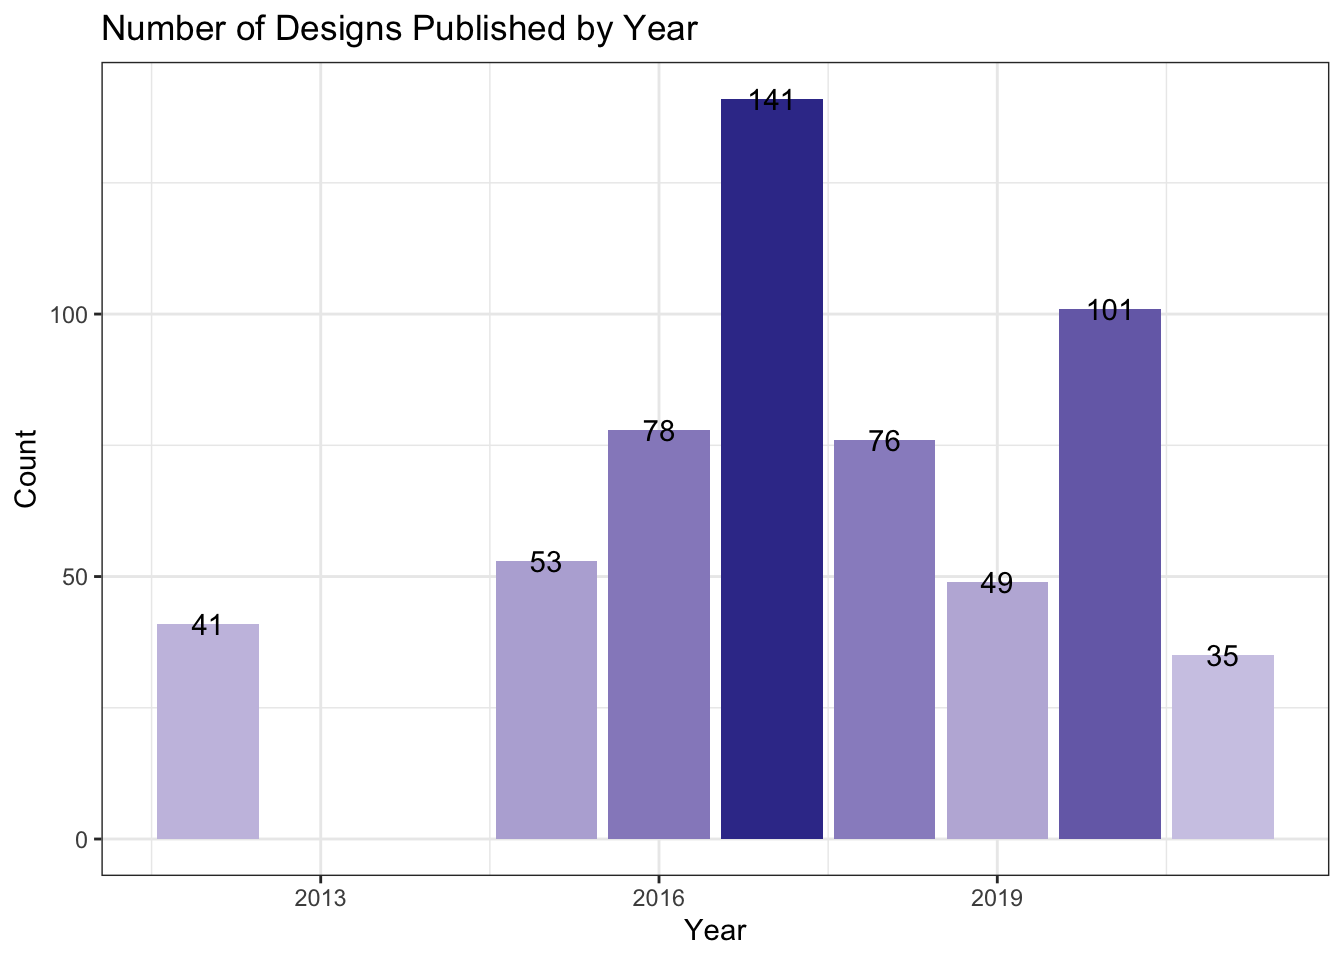
labels |>group_by(year) |>count(year) |>filter(n >25) |>ggplot(aes(x = year, y = n, fill = n)) +geom_bar(stat ="identity", show.legend =FALSE) +geom_text(aes(label = n)) +scale_fill_gradient2() +theme_bw() +labs(title ="Number of Designs Published by Year",x ="Year",y ="Count" )
year
n
2011
1
2012
41
2013
25
2014
10
2015
53
2016
78
2017
141
2018
76
2019
49
2020
101
2021
35
2022
11
2023
1
Note that the graph is filtered to include only years with more than 25 package labels. The dataset spans from 2011 to 2023, but due to Envato Market’s data collection guidelines, the majority of the data is concentrated between 2017 and 2020.
Even though there were only 25 package labels from 2013 in our dataset, 2 of those designs are in our Top 5 in sales. 2016 was also a good year for sales with with 2 of the 78 designs making the Top 5 as well.
Notably, the two “Labels” designs ranked 4th and 5th cater to different purposes: the 4th design focuses on cosmetic label templates, while the 5th provides labels for bottles and containers. Both were created by the same designer, mihalymm, showcasing their strong presence in this dataset. Using this information, let’s explore how frequently specific creators appear across the years.
Most Popular Creator & Sales Strategy
For the labels that we have let’s see if a majority of them were created by a common user or not.
creator
n
graphicgrow
118
Plexa_Designs
65
Dkgray
59
jumpingideas
46
packgallery
41
mihalymm
34
monostudio
23
Artsoldiers
19
joiaco
14
ArtBeatDesigns
13
The top 10 creators with the most designs on Graphic River in our dataset are shown above, we can see that graphicgrow is the the top creator that created 118 of the 622 designs that we are analyzing. Plexa_Designs is 2nd with 65 designs and Dkgray is 3rd with 59 designs.
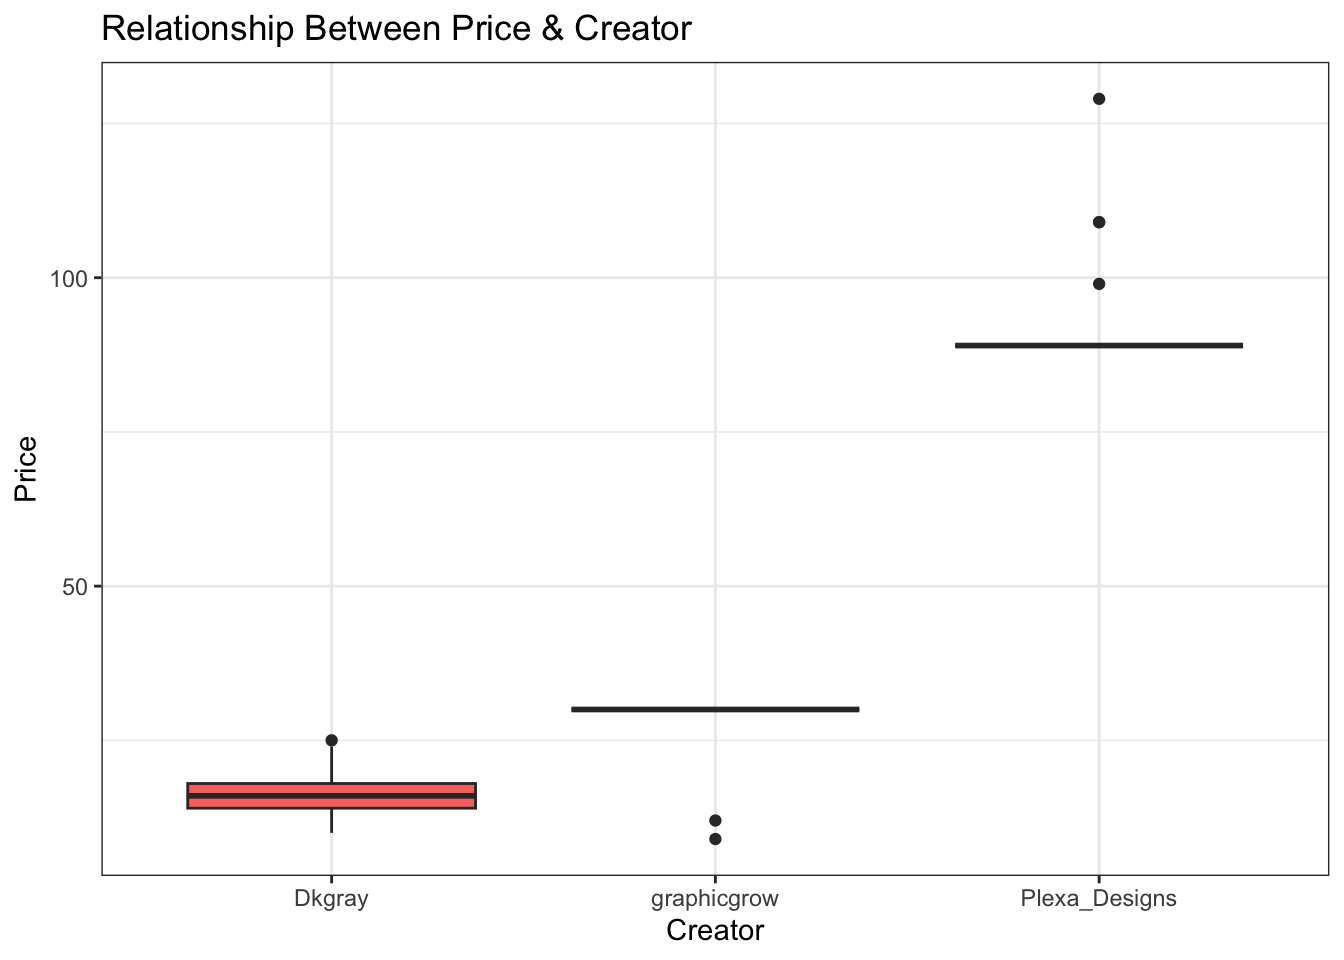
Let’s further look at these creators to explore their sale strategies.
This boxplot may not be the most visually appealing, but it provides valuable insights. We can see that graphicgrow sells nearly all designs for $30, with only two exceptions sold for less. Plexa_Designs operates at a higher price range, selling most designs for $89, excluding three that are priced even higher. Dkgray is the most interesting, whose designs are priced between $10 and $25, showcasing a unique pricing strategy.
creator
total_sold
median_price
total_profit
Dkgray
780
16
12480
Plexa_Designs
621
89
55269
graphicgrow
918
30
27540
Although graphicgrow has the most designs on Graphic River, Dkgray has sold the most designs among these top three creators, which could be attributed to the accessible price range of their designs. Based on the median price for these creators, it is evident that Plexa_Designs has generated the highest revenue. Next, let’s examine when these creators were most active in releasing new designs.
Code
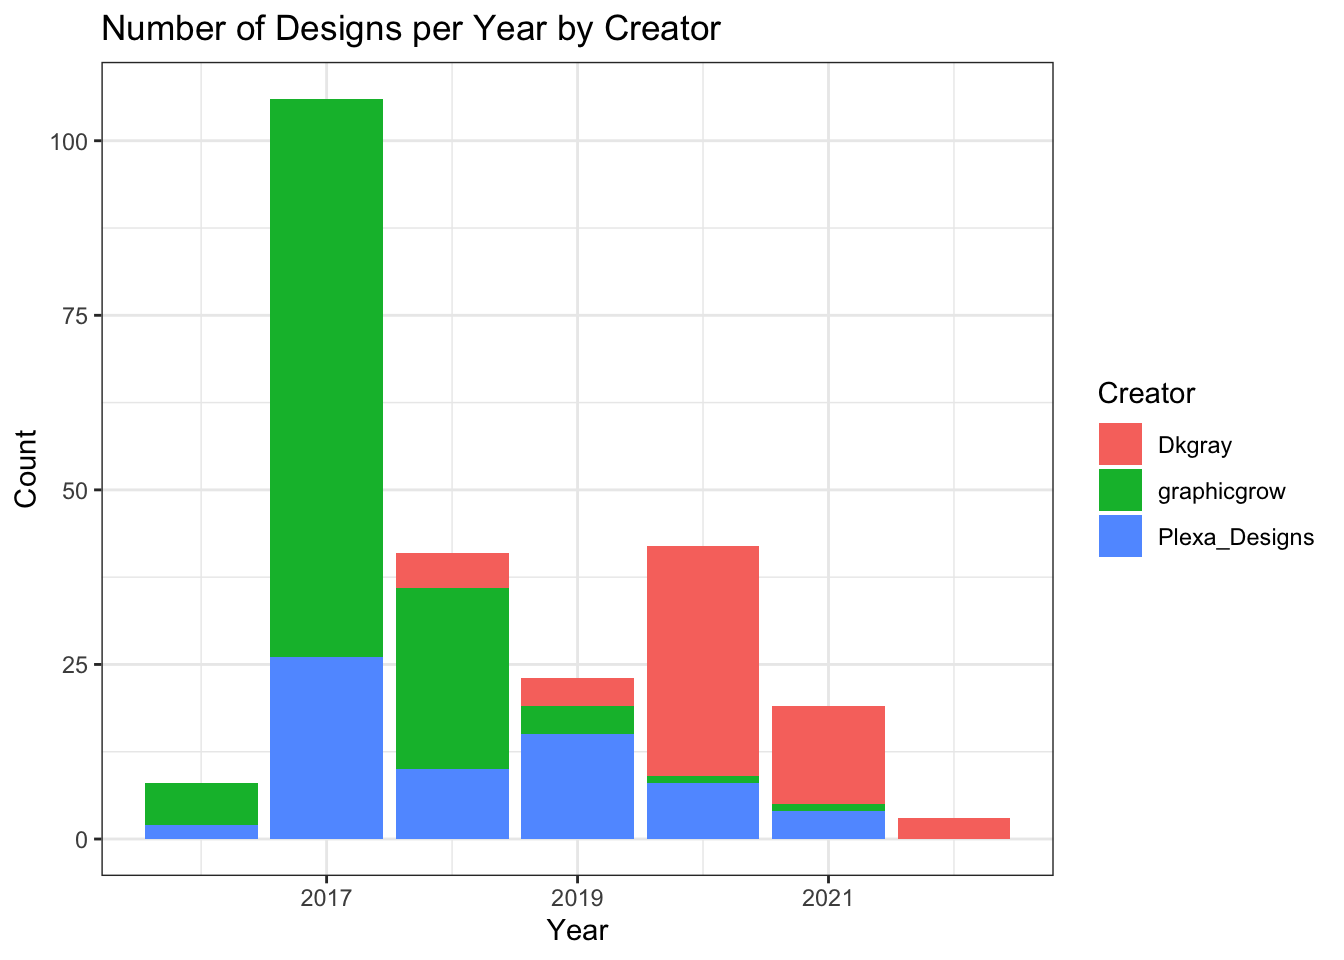
labels |>filter(creator =="graphicgrow"| creator =="Plexa_Designs"| creator =="Dkgray") |>group_by(creator) |>count(year) |>ggplot() +geom_bar(aes(x = year, y = n, fill = creator), stat ="identity") +labs(title ="Number of Designs per Year by Creator",x ="Year",y ="Count",fill ="Creator" ) +theme_bw()
2017 was an active year for graphicgrow, followed by a gradual decline in designs, ultimately tapering off after 2021. Plexa_Designs began releasing designs in 2016, peaked in 2017, and steadily decreased activity thereafter, with no new designs in 2022. Dkgray entered the scene in 2018, with 2020 being the year they released the most designs. Interestingly, some of these creators have since transitioned to operating their own websites.
Insight Into Labels
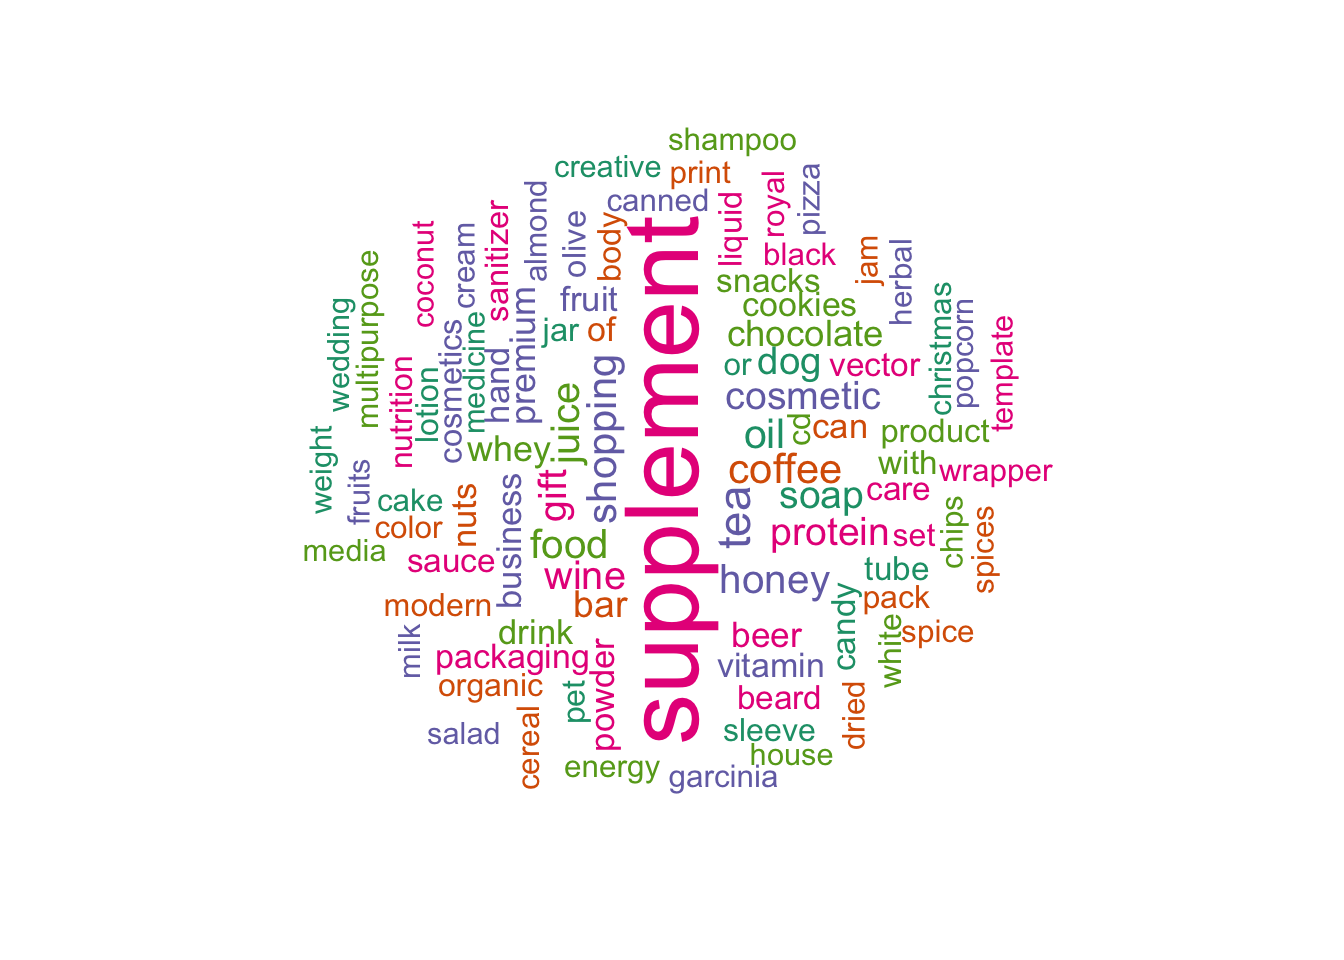
Now that we have an understanding of the price ranges, release years, and other characteristics of the most popular designs, let’s explore which product labels are the most popular in terms of their intended use.
The most common design categories include supplements, tea, coffee, shopping, and oil. The table above highlights the frequency of these words appearing in the titles of the designs. However, it’s worth noting that some designs are generically titled ‘Label,’ making it impossible to categorize them based solely on their titles. As a Division III athlete, I am particularly interested in supplement designs and the price ranges associated with these designs.
Code
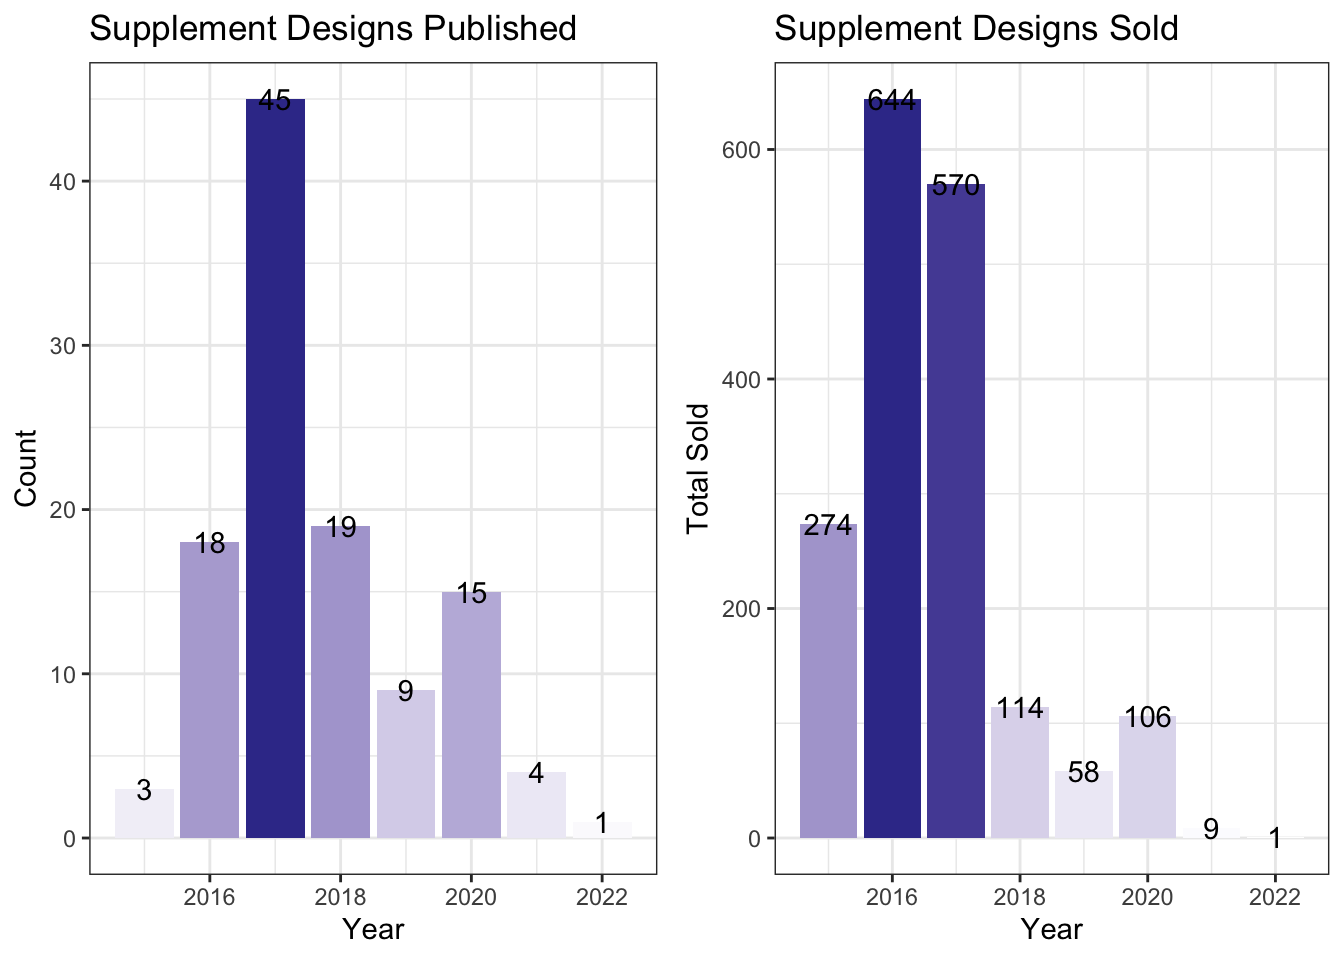
supple_publish <- supplement |>group_by(year) |>count(year) |>ggplot(aes(x = year, y = n, fill = n)) +geom_bar(stat ="identity", show.legend =FALSE) +scale_fill_gradient2() +geom_text(aes(label = n)) +theme_bw() +labs(title ="Supplement Designs Published",x ="Year",y ="Count" )supple_sold <- supplement |>group_by(year) |>summarize(total_sold =sum(n_sale)) |>ggplot(aes(x = year, y = total_sold, fill = total_sold)) +geom_bar(stat ="identity", show.legend =FALSE) +scale_fill_gradient2() +geom_text(aes(label = total_sold)) +theme_bw() +labs(title ="Supplement Designs Sold",x ="Year",y ="Total Sold" )# aligning grids in html using cowplotplot_grid(supple_publish, supple_sold)
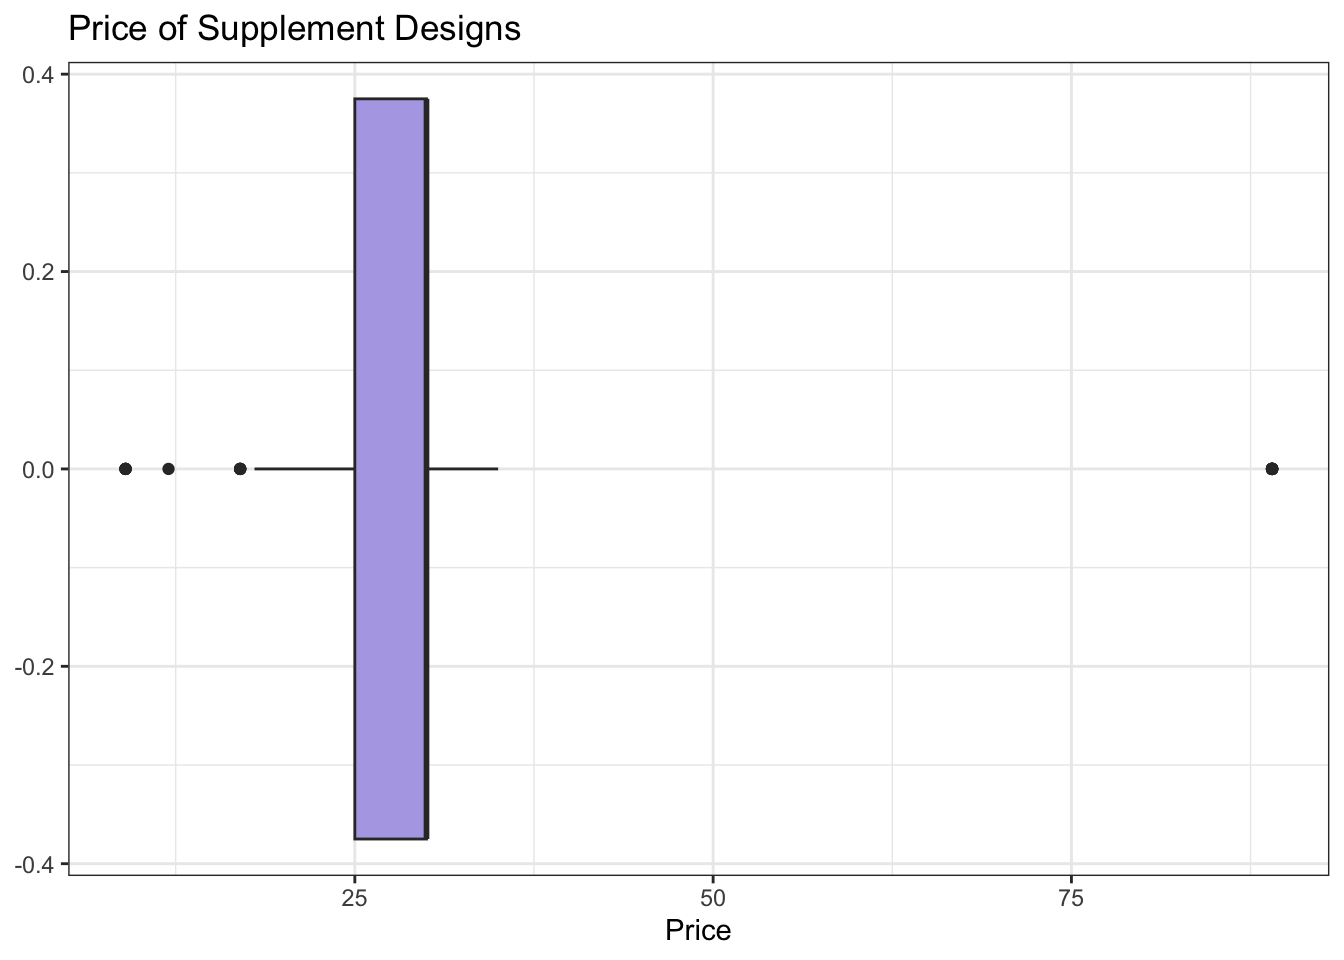
More supplement designs were released in 2017; however, the year with the highest number of supplement designs sold was 2016. Let’s take a closer look at the price range these designs are selling for.
These designs are selling for as low as $9, with a median price of $30 and a maximum of $89. The interquartile range (IQR) is $25 to $30, indicating that the middle 50% of the designs fall within this price range.
creator
total_sold
graphicgrow
480
jumpingideas
437
designstudios
415
Artsoldiers
226
Plexa_Designs
155
We again see creators graphicgrow and Plexa_Designs are in the Top 5 for most supplement designs sold, also new creators such as jumpingideas in 2nd, designstudios(https://graphicriver.net/user/designstudios/portfolio) in 3rd and Artsoldiers(https://graphicriver.net/user/artsoldiers/portfolio) in 4th.
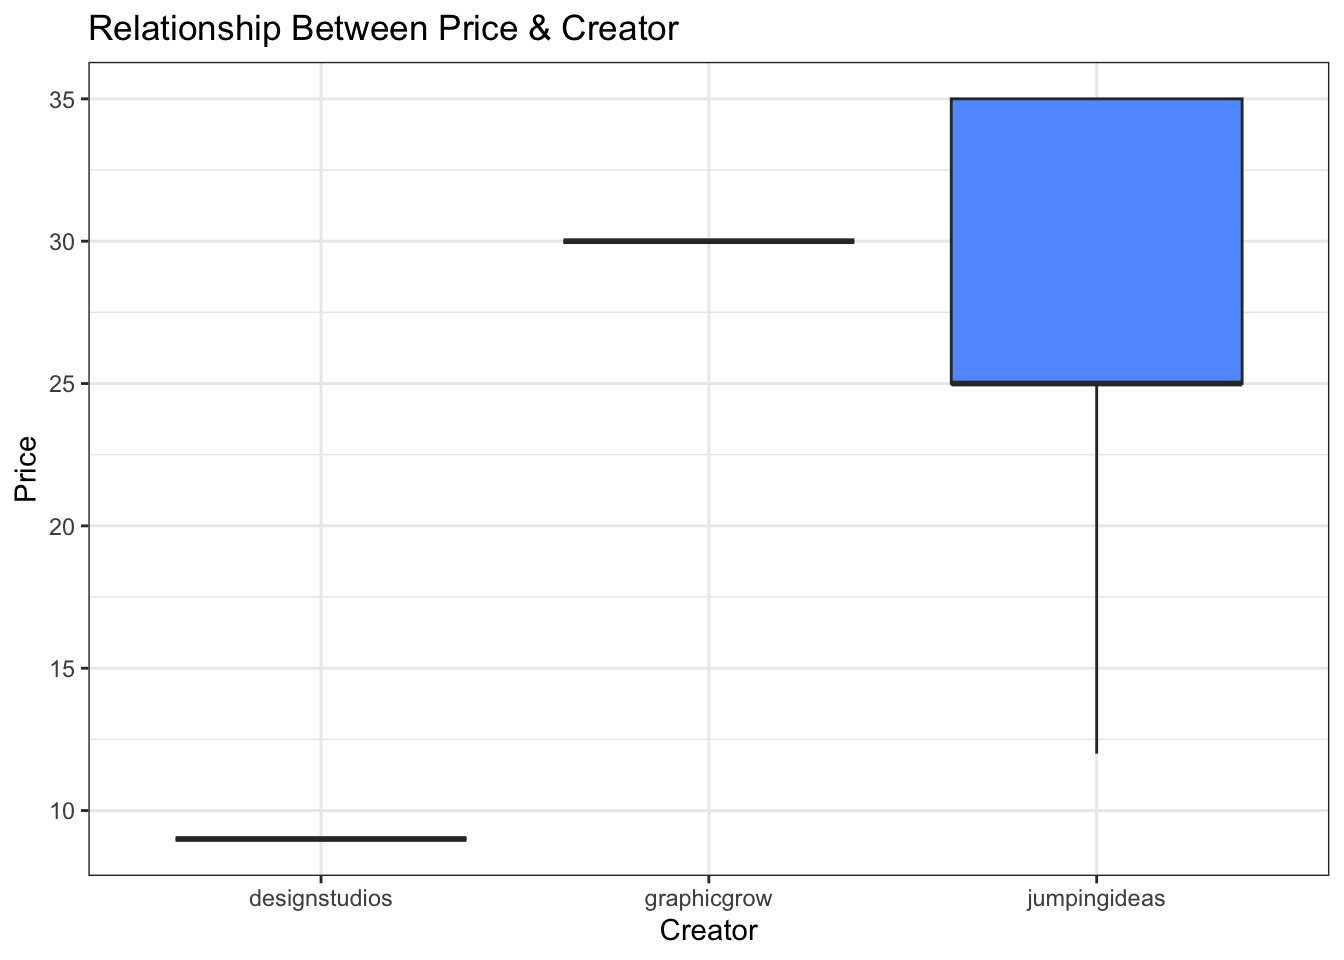
Again, while the boxplot may not be the most visually appealing, it still provides valuable insights. designstudios consistently prices all designs at $9, graphicgrow maintains a price point of $30 for its designs, and jumpingideas has prices range from $12 to $35.”
title
creator
n_sale
price
year
Label Design Bottle Nutrition Supplement
designstudios
216
9
2016
Label Design Bottle Nutrition Supplement
designstudios
113
9
2015
Supplement labels
jumpingideas
104
25
2015
Label Design Bottle Nutrition Supplement
designstudios
86
9
2016
Supplement Label Vol-06
Artsoldiers
65
18
2017
Here are the links to the Top 5 designs with the most sales, in respective order from above:
After analyzing these designs, I am ready to implement some of the key elements observed in the top 5 designs. These designs are typically divided into three parts: the front, which features the company name and product; one side, which includes a supplement facts label and a barcode; and the other side, which contains a few lines about benefits, company information, and suggested use. The dimensions generally range between 2–3 inches in height and 6–8 inches in length. These designs also have very BOLD fonts and colors.
For the files itself these designs are all layered and usually come with 2-3 different templates. Everything is editable which I think is the most appealing aspect, such as size, color, and fonts. File types consists of photoshop documents, psd, adobe illustrator, ai, encapsulated postscript, eps, and portable document format (pdfs).
For my design I wanted to keep it clean by not using too many colors, and a single font. I like things not cluttered and simple, if you could not tell by my theme choice in graphs and colors. Below is my first label design.
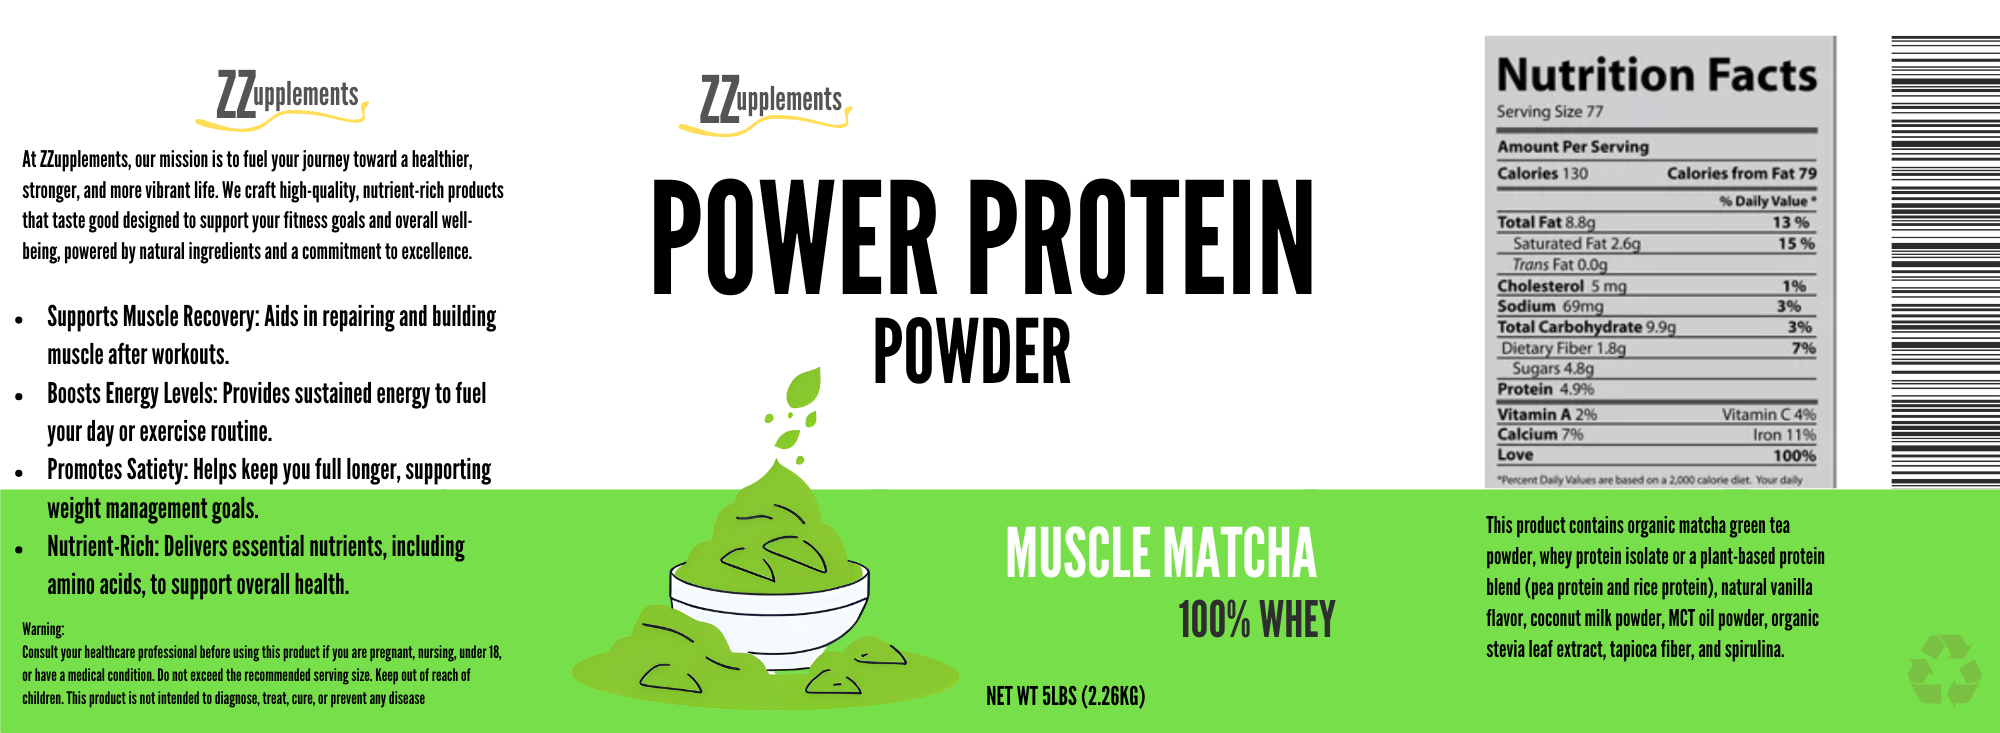
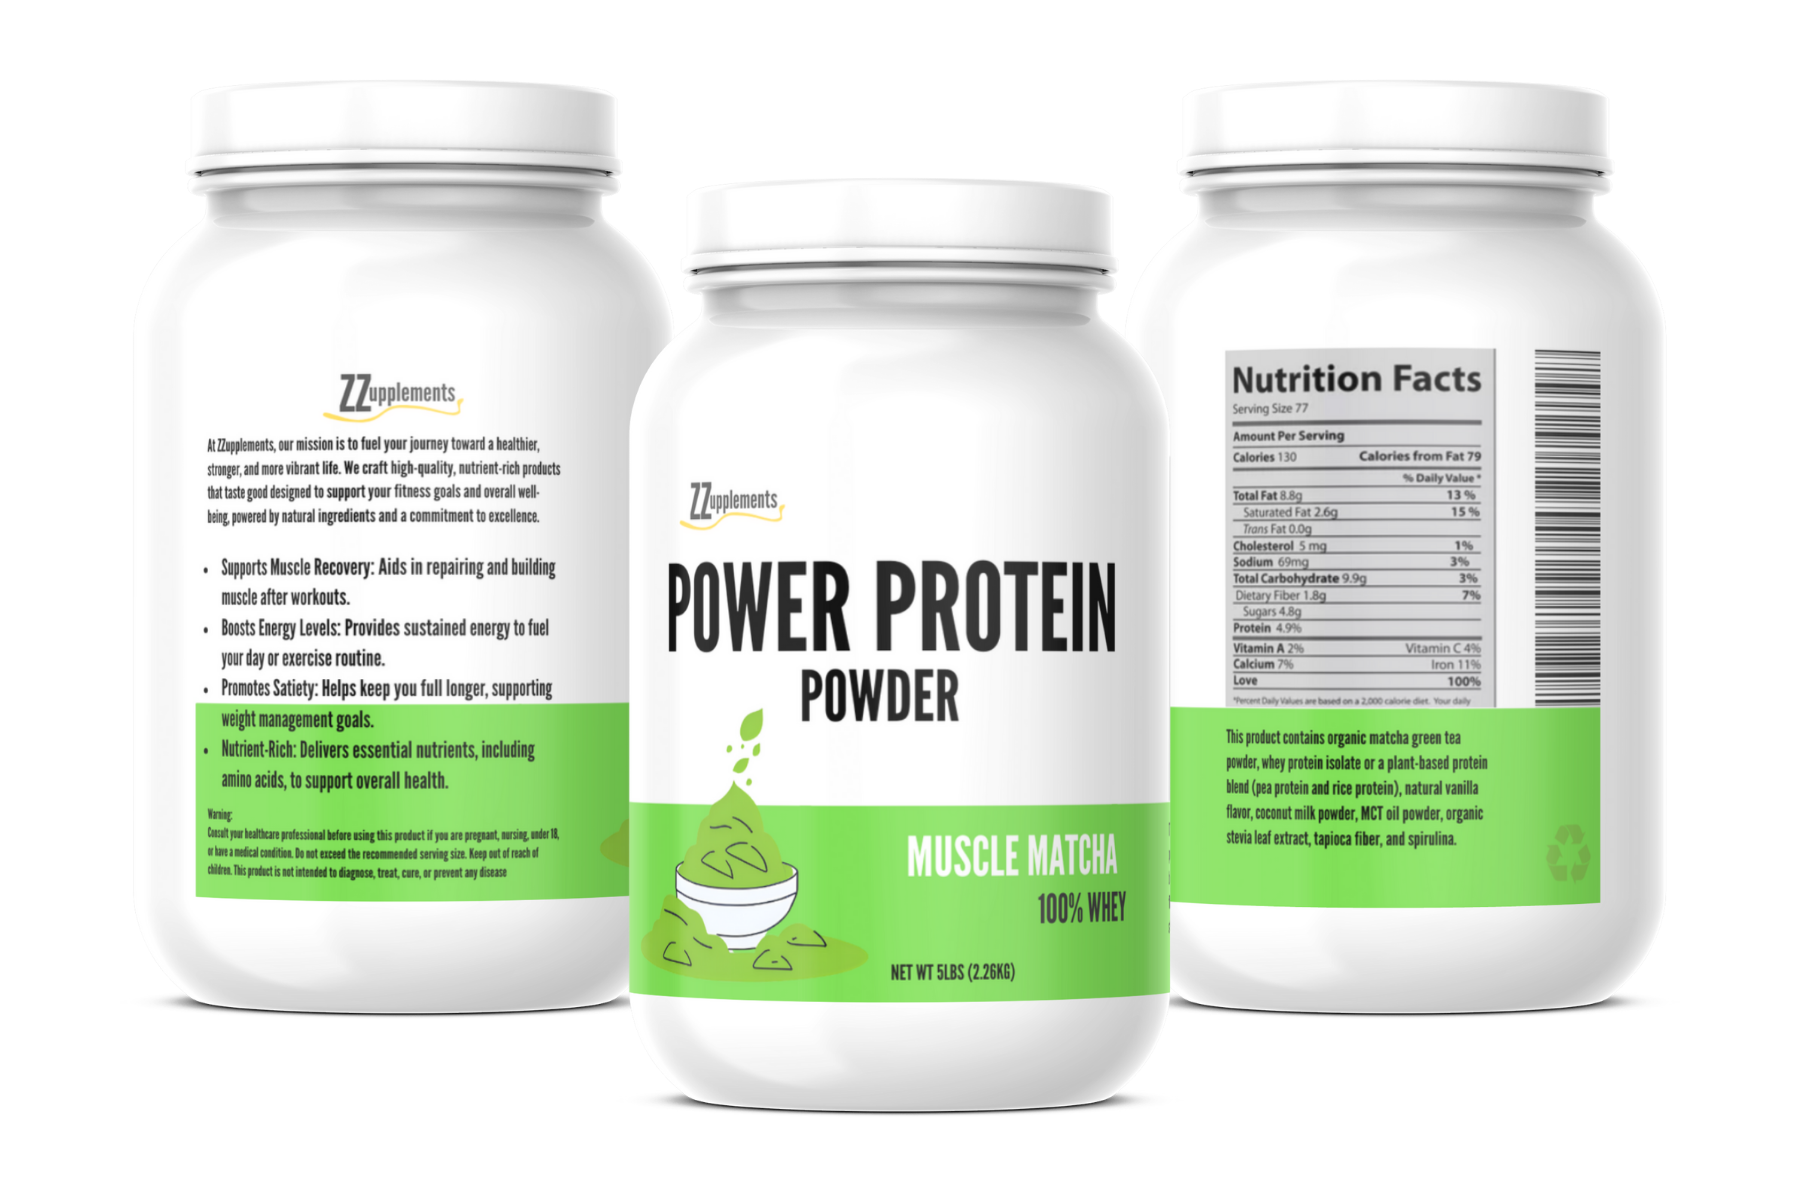
Label for matcha flavored protein powder supplement jar, that is 7.5in by 2.75in created in Canva.
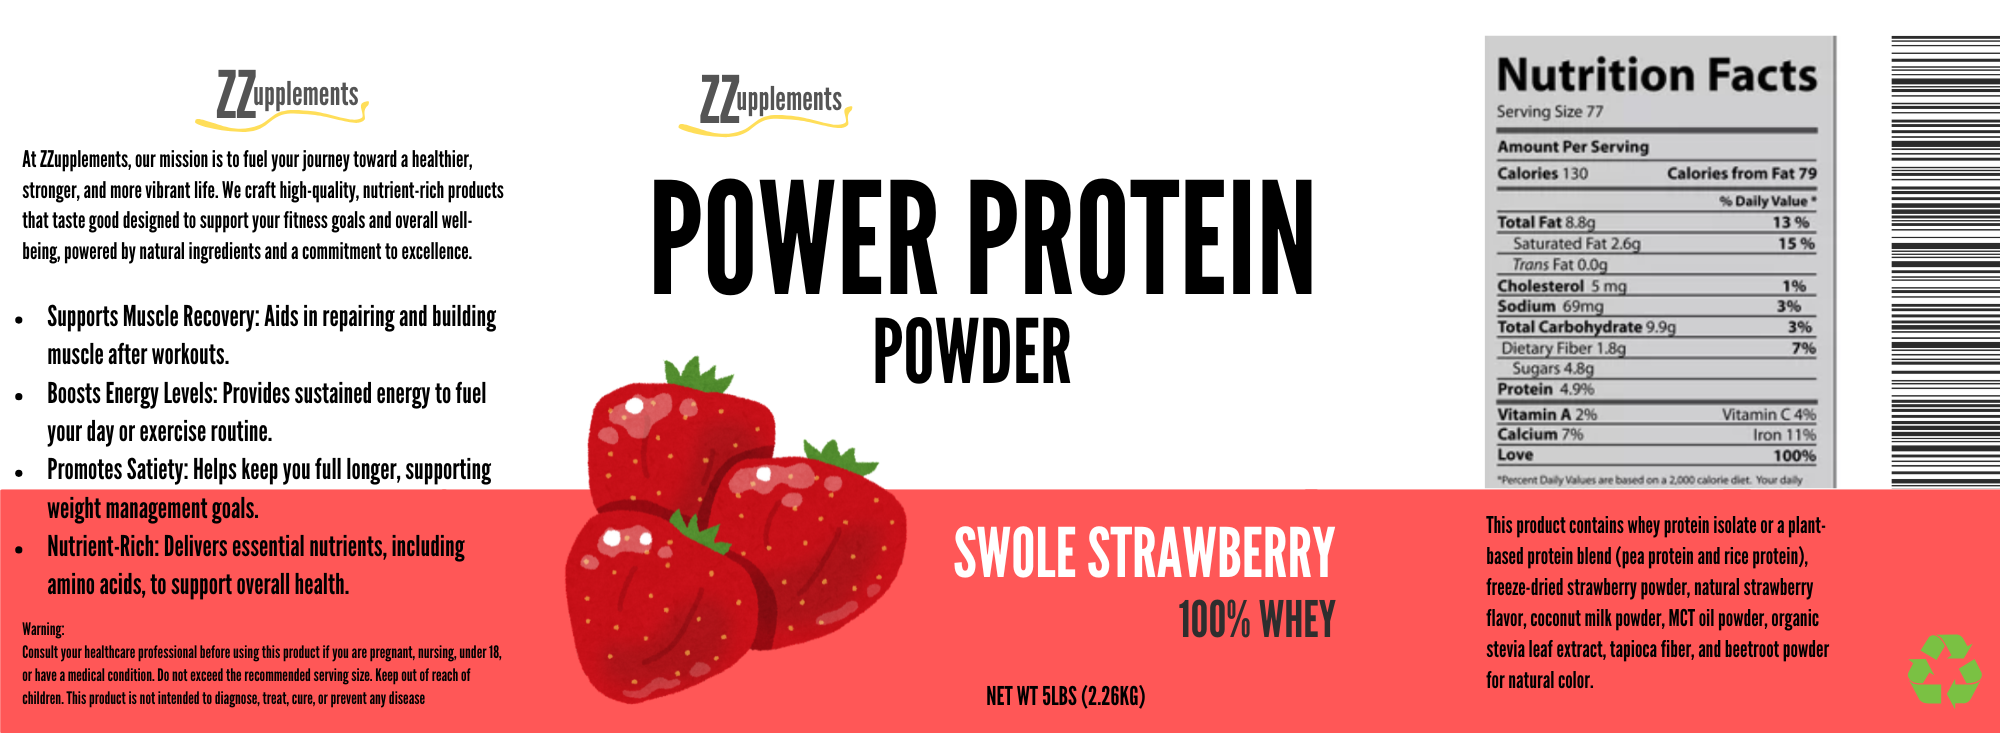
On the right bottle we have the nutrition label, ingredients, and barcode. At the top of the left bottle, we have the company name that is producing the product which is ZZupplements and a little about the company, or customizable to be about the product itself as well. Front and center we have the most important view, what the customer sees and what your brand is known for. I decided to go with POWER PROTEIN POWDER for repetition as well as a good view of PROTEIN POWDER which is what my product is. I also decided the bottom third to be green to match the flavor for that clean look I am looking to achieve. As well as a photo to represent the flavor so people don’t have to look so hard for the flavor. Similarly, I created a label for the flavor strawberry using the same concept.
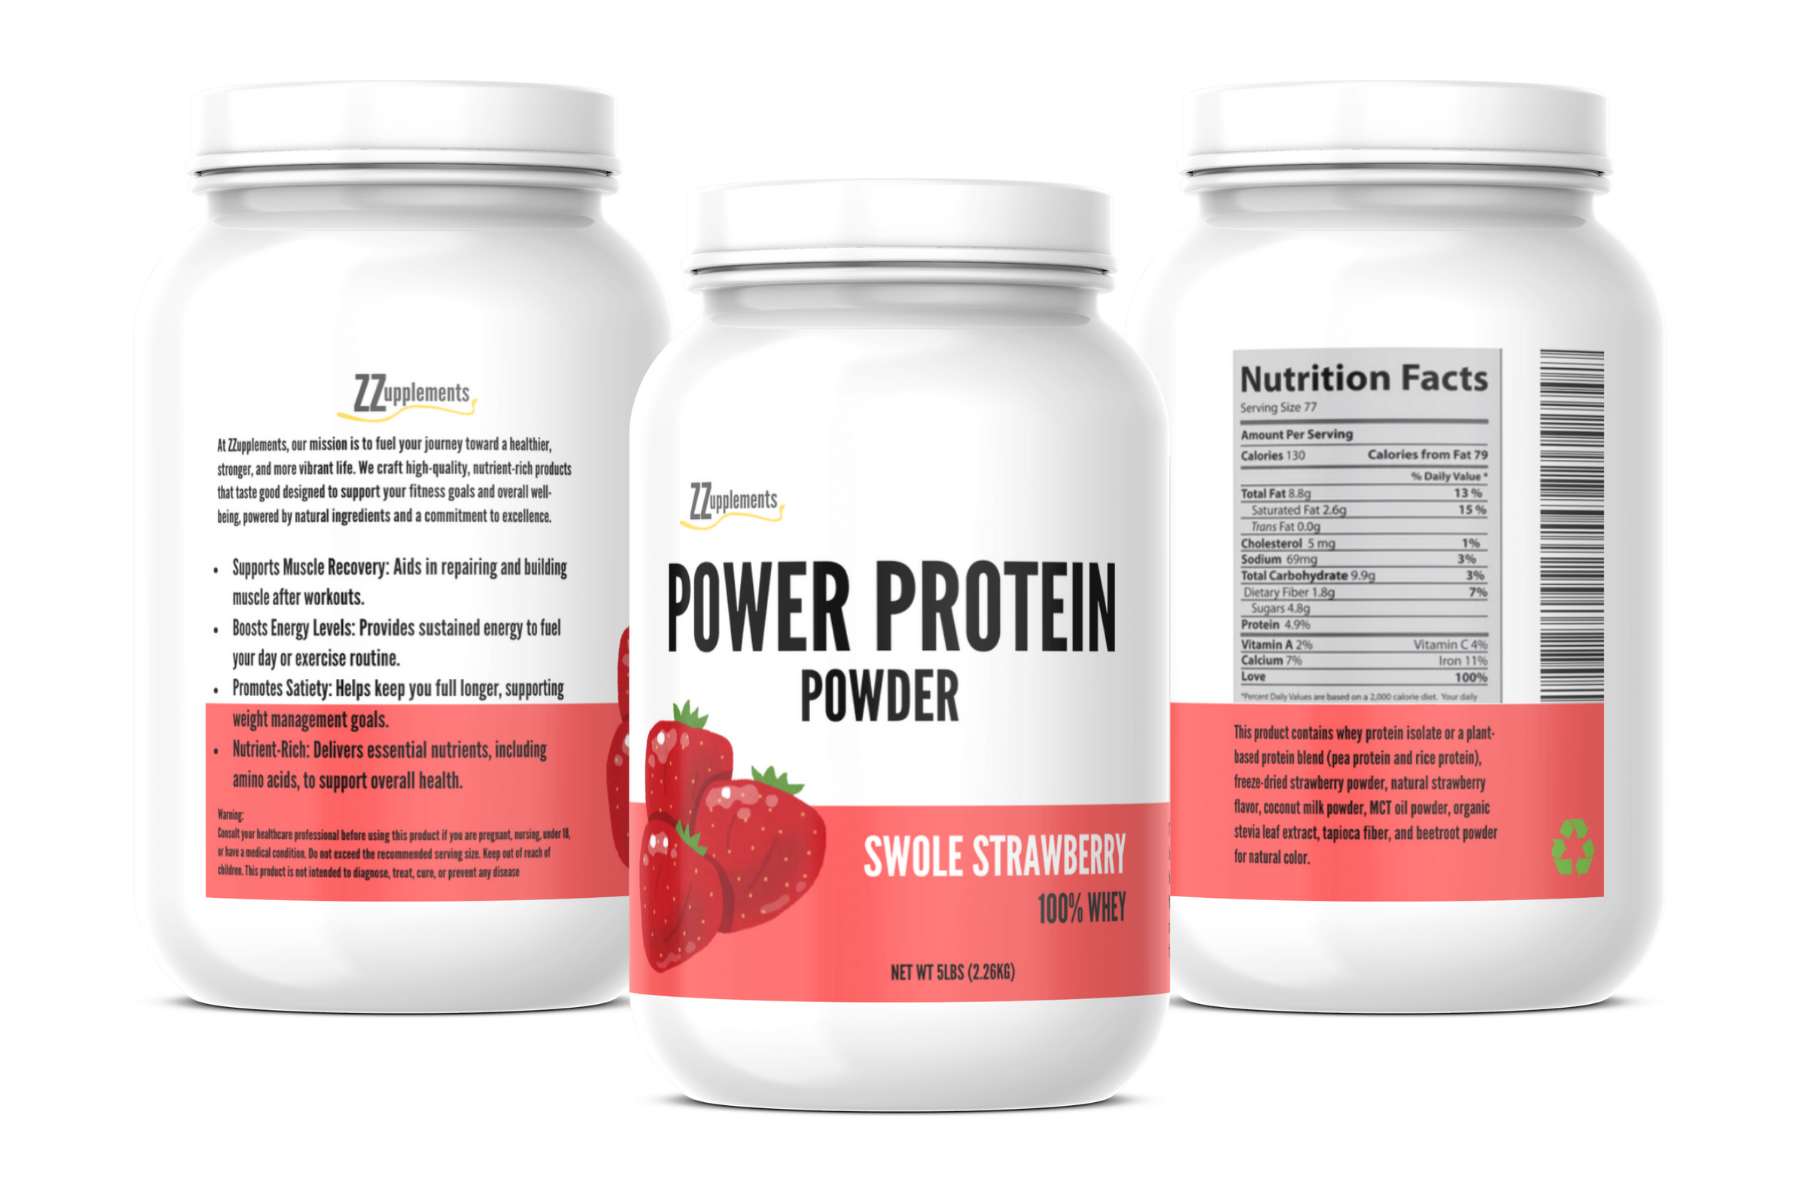
Label for strawberry flavored protein powder supplement jar, that is 7.5in by 2.75in created in Canva.
I would not sell these designs but put them out on the internet for free as inspiration to others considering my designs are not layered, is only available in pdf format and not easily editable.
Elements of Design:
Color: Color of bottle to represent flavor of protein powder, the shade of my green and red are bright and welcoming opposed to sharp and cautionary.
_ Lines: Sharp line of bottom third of color for cleaniness look, labels and barcodes are all straight, and words are also all zero degrees for “straightness”
Shapes: The images on both bottles are illustrated and not real photos, adds to the overall feel of the bottle.
AI Implementation
With my knowledge of package deigns now and having some experience with designing my own package label, I am curious how AI is able to interpret and design these labels.
With this prompt “Create an Image: A 7.5in by 2.75in design for a package label. The company is ZZupplements, the product is Power Protein Powder, the flavor is matcha, this is a 100% whey product.” I utilized three different AI models to create these labels.
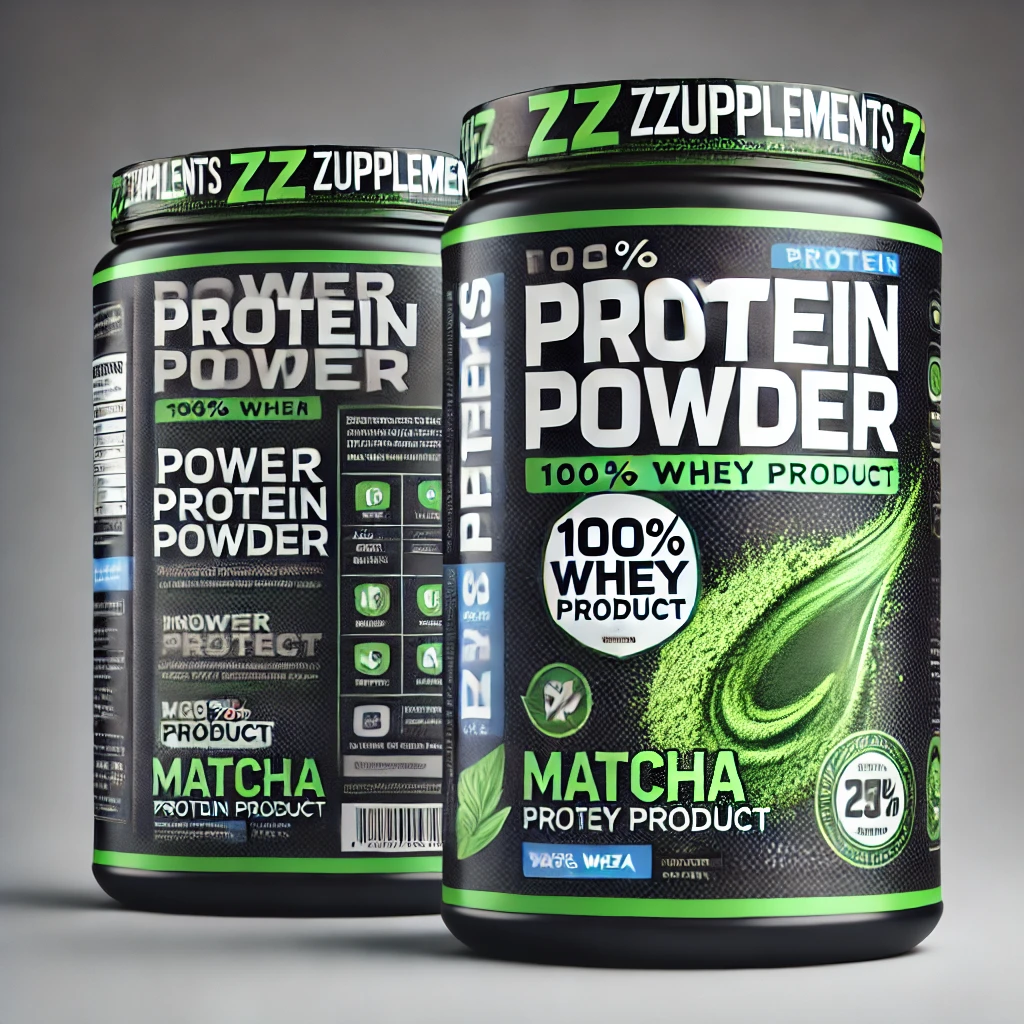
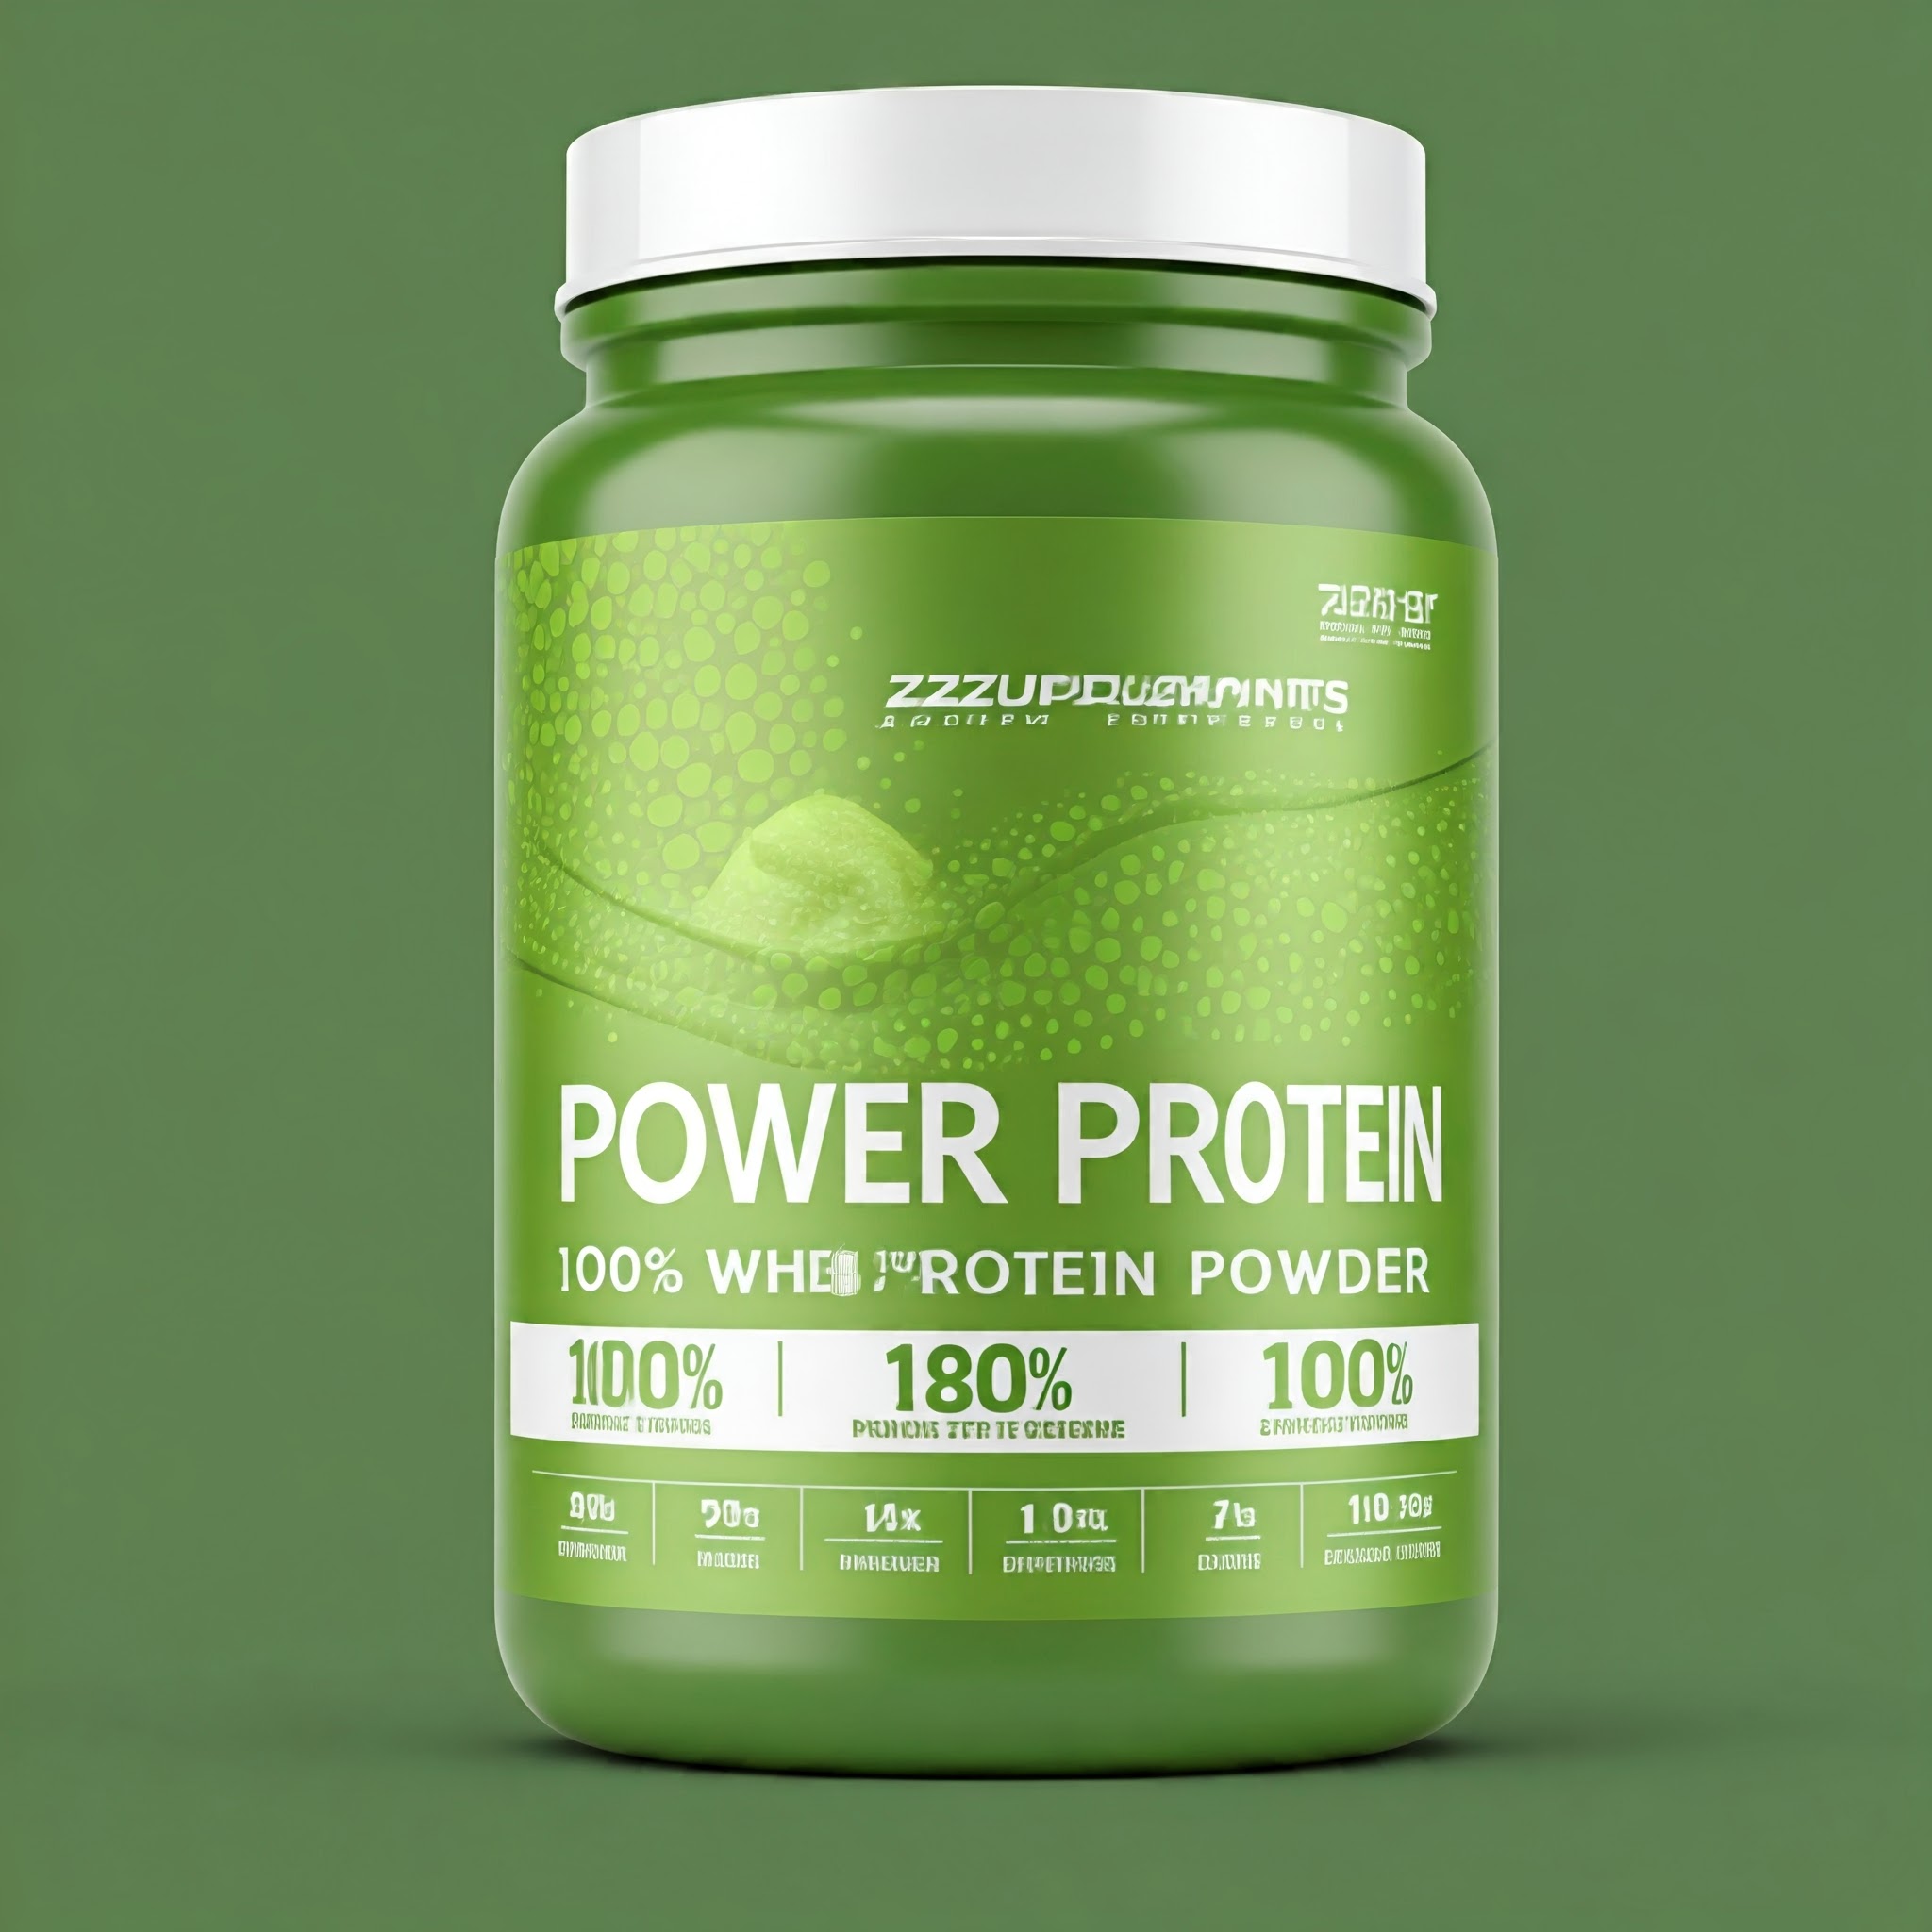
ChatGPT
This image was generated with our prompt in ChatGPT. I should’ve been more specific because I wanted the label itself however I got two jars with this design. It is really interesting because the font used for “POWER PROTEIN POWDER” is almost identical, I guess I am generic. Notice how some of the words on the label are blurry, we can’t really tell what it is saying.
Color: Color of label to represent flavor of protein powder, also uses a shade of green for matcha and the matcha powder. Background is a darker grey with shadows. Very interesting that a blue is used as well.
Lines: Sharp lines are used, labels and barcodes are all straight, and words are also all zero degrees for “straightness”.
Shapes: There a couple of rectangles that are different colors to help some of the more important words.
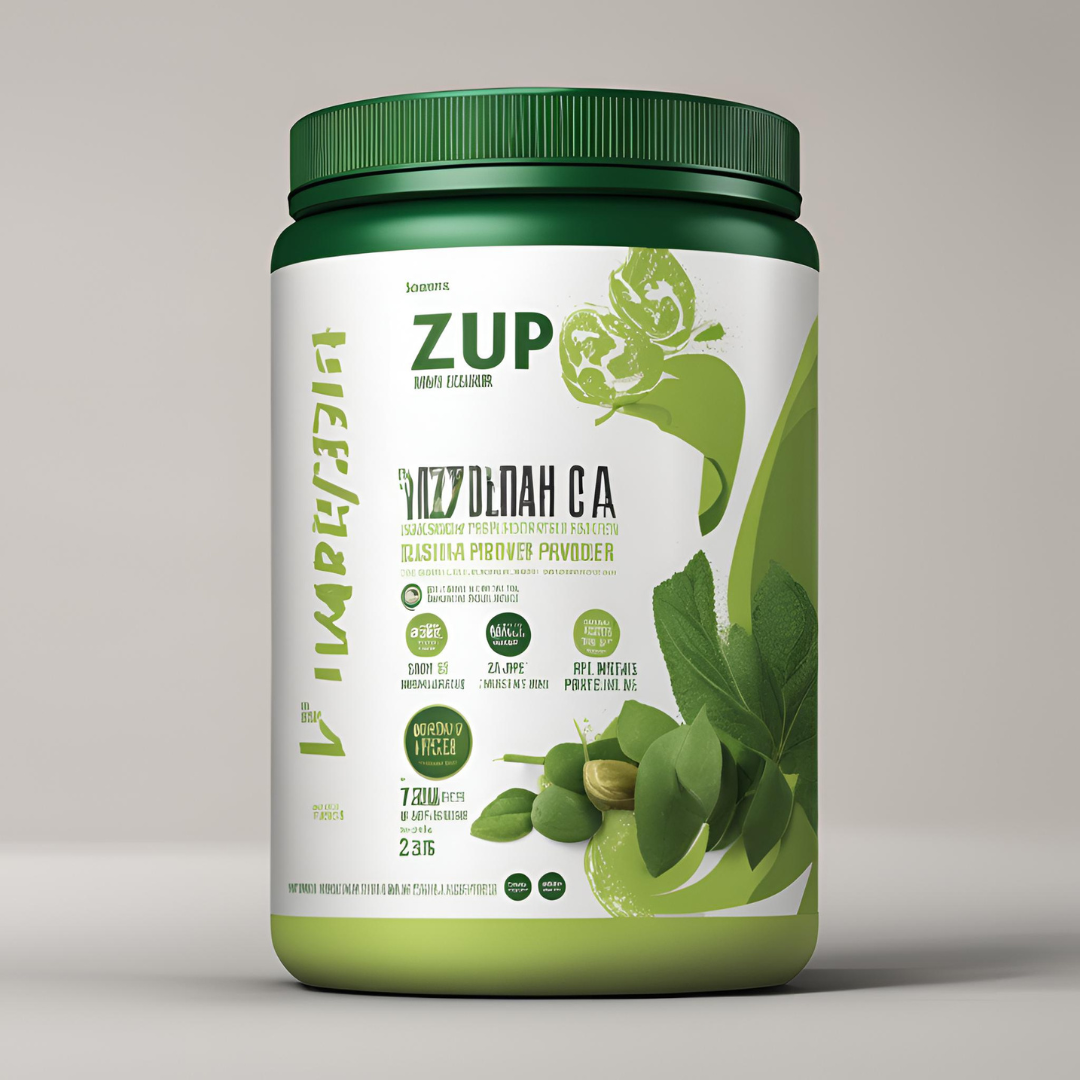
Google Gemini
For this AI generated image we used Google Gemini, it also gave our label to us in bottle form, where the bottle is primarily green and the background is green. It is interesting to see that even though I gave it Power Protein Powder it was only able to somewhat put it on the image. There is just some legible English on this design.
Color: Color of label to represent flavor of protein powder, also uses a shade of green matcha. Background is green. Bottle is also green just fully incorporating the matcha vibe.
Lines: Sharp lines for cleaniness look again, everything is formatted nicely. There 2 curved lines for a flowly look.
Shapes: A rectangle is used with text inside as this also adds to the sharp lines. Dots around the curved lines.
Canva Magic Media
Canva Magic Media was used to create this image. Our label is also in bottle form however there is no curve in this container. This is probably the most unique image that we generated. Again there is no legible English on this design.
Color: Color of the label is white, also uses a shade of green matcha. Background is grey, the bottle is two different shades of green, with a green cap, there are more shades of green used in this label compared to all of the others.
Lines: Are not all sharp anymore, we have curves on the side kind of wrapping an image
Although without a more specific font we can see the AI is more useful as inspiration and not the final product. These images aren’t available in psd form which mean if you’re looking for a label that you can adjust it would give you more work converting it into a psd and creating the layers yourself compared to designing your own.
Conclusion
This project allowed me to apply my design knowledge with an analysis done in R. By analyzing top designs on GraphicRiver, I was able to identify key trends such as price, layouts and bold yet minimalistic styles, all of which I integrated into my own label designs. Creating labels for matcha and strawberry-flavored protein powders enabled me to meet the project’s creative deliverables by demonstrating application of the skills learned in class. Additionally, exploring AI tools like ChatGPT, Google Gemini, and Canva Magic Media showcased my ability to leverage technology. This experience not only enhanced my design skills but also helped me understand the intersection of creativity and technology, a crucial step in achieving my long-term goals in design and beyond.